I debugged the same failed API call on five workflow platforms. Four of them said it succeeded.

The workflow runs 200 times a day. On day three, Salesforce starts rejecting some records — duplicate email addresses. The API returns a 400 with a perfectly clear error body: "DUPLICATES_DETECTED: duplicate value found". The HTTP request completed. The platform marks the step as successful. The workflow continues. Downstream steps reference a contact that was never created.
You find out two weeks later when someone asks why half the leads from March are missing from the CRM.
I have hit this exact scenario on Zapier, Make, n8n, and Power Automate. Every single one of them handled it the same way: green checkmark, workflow continues, nobody gets alerted. The step “succeeded” because it got an HTTP response. The fact that the response said “I didn’t do the thing you asked me to do” was just… data.
This is the error handling problem that nobody in the workflow automation space is talking about. Not because it is hard to understand, but because nobody has solved it.
The binary error trap
Every workflow platform I have used treats errors the same way: either the step threw an exception, or it succeeded. Network timeout? Exception. Code crash? Exception. DNS failure? Exception. The platform catches it, marks the step as failed, stops the workflow or retries. This is table stakes and every platform does it fine.
But an HTTP request that returns a 400? A CRM API that returns "record rejected"? A telephony platform that sends back a SOAP fault code inside a 200 response? Those are all “successful” steps. The request went out, a response came back. Mission accomplished.
This is where production automations actually break, and it is where every platform I have tested comes up short.
What each platform actually shows you
I am not going to be diplomatic about this. I have used all of these in production and I have wasted hours debugging on each one. Here is what you actually see when an API returns a 400.
Zapier
To be fair, Zapier has improved here recently. Their API Request actions now surface HTTP response data — status code, message, and status. That is progress. But error messages in the task view are still truncated to 250 characters, and for non-API-Request step types the experience has not changed much. You still end up clicking into a separate HTTP logs tab to find the actual response, and even there the detail varies by step type.
Zapier also has Copilot for building workflows from natural language, and a beta AI troubleshooting feature that generates a plain-language summary when a task fails — error location, likely cause, suggested fixes. That is real, and worth acknowledging. But it is summarizing the error at the failed step, not tracing the data flow across the entire execution to find root causes upstream. More on that below.
The deeper problem remains: Zapier does not distinguish between “the step threw an exception” and “the API returned an error response.” Depending on the step type and configuration, a 400 response can still be marked as a successful task. The workflow continues. There is no concept of operational errors.
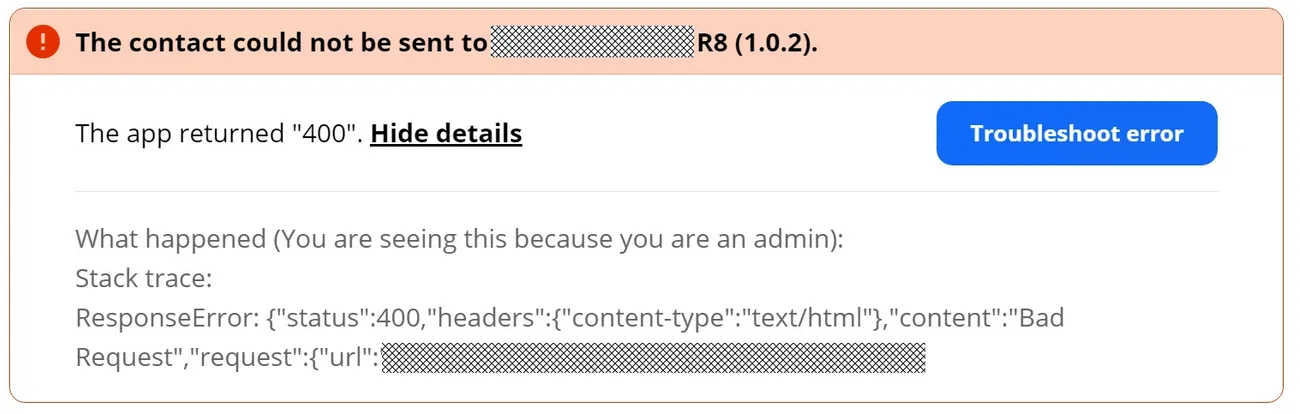
This is what you get. A raw ResponseError JSON string with "content":"Bad Request". The actual API response body — the part that tells you why it failed — is not shown. You get the status code, a content-type header, and the word “Bad Request.” Good luck debugging that at scale.
Make
Make shows HTTP status codes, which is better than nothing. But the response body is often missing or requires multiple clicks to find. You see the red bubble on the module, you click it, you get some detail. If you need more — full request/response data, headers, timing — you are either installing the Make DevTool browser extension or digging through the Execution Log Inspector. The information is there if you know where to look, but it is not surfaced in a way that makes debugging fast.
Make has also invested heavily in AI recently. Their conversational builder, Maia, lets you generate and refine scenarios through iterative dialogue — you can redirect and co-create as you chat, which is a genuinely good experience for building. But for debugging, Make still relies on traditional tooling: execution logs, custom exception routes, and their Scenario Run Replay feature (which re-runs a scenario using historical trigger data, useful for reproducing issues but different from stepping through past execution data). No AI-powered error diagnosis exists yet.
The community forums are still full of posts like “Error 500 with no explanation” — users who can see that something failed but cannot figure out why because the actual API response is buried or absent.
And like Zapier, Make has no concept of a step that “ran successfully but produced a bad outcome.” A 400 response either throws (if the module is configured to) or passes through silently.
n8n
n8n is the closest to getting this right. It shows input/output JSON per node, and the Debug Node lets you inspect data at arbitrary points in the flow. If you are comfortable reading raw JSON, you can find the information you need.
But n8n has its own problems. The HTTP Request node has a documented issue where it serializes JSON request bodies as strings when you use expressions to build them. This means APIs that expect a JSON body receive a string-wrapped version, reject it with a 400, and you spend an hour debugging your workflow logic before realizing the platform is mangling your payload. That is not a configuration issue. It was reported as a bug on GitHub (issue #15996) and closed as “not planned” — meaning it is considered expected behavior, not something that will be fixed.
n8n also has no concept of operational errors. A 400 response is either an exception (if you have “Throw on Error” enabled) or a successful execution that you have to manually inspect. There is no middle ground.
Power Automate
Power Automate might be the most frustrating of the four. When an API returns a 500, Power Automate frequently wraps it as a “502 BadGateway” error in its own error layer — meaning the status code you see is not even the status code the API returned. You are debugging through two layers of indirection.
Error extraction is, in one developer’s words, “anything but simple.” The community has published multiple workaround guides and custom solutions just to make error details accessible from Power Automate’s run history. That should tell you everything about the built-in experience.
Run history is retained for 28 days. After that, your debugging information is gone. If a silently failing workflow runs for three weeks before someone notices, you have roughly one week of history left to figure out what went wrong.
Power Automate does have Copilot, and to be fair, it is the most capable AI assistant of the four competitors. It can generate flows from natural language and it has a “Troubleshoot in Copilot” feature that reads actual error messages from failed runs and produces human-readable summaries with suggested fixes. That is closer to what you want than anything Zapier, Make, or n8n offers.
But even Microsoft’s own docs caveat it: “Copilot isn’t equipped to help with fixing flow errors currently” and “might not work in all scenarios.” In practice, it reads the error message itself — the string — but does not inspect variable states, intermediate outputs, or the full execution context. It cannot tell you that step 8 produced bad data that caused step 12 to send a malformed request that the API rejected. It sees the error at step 12 and suggests fixes for step 12.
The gap is detection, not handling
Every platform has try/catch. Every platform can retry a failed step. Every platform can send an alert when a step throws an exception. That is not the problem.
The problem is that most failures in production automations are not exceptions. They are HTTP responses with error payloads. They are API calls that return a 200 with "status": "failed" inside the body. They are SOAP services that send fault codes wrapped in successful HTTP responses. These are the failures that do not trigger any error handling, on any of these platforms, because as far as the platform is concerned, nothing went wrong.
The gap is not in error handling. It is in error detection. The platform cannot handle an error it does not know about.
What I built instead
When I hit this problem for the third or fourth time, I stopped trying to work around it and built a different model. None of the platforms above — not one — can tell you that a step “succeeded” but the operation failed. So I built an engine that can. QuickFlo’s workflow engine has two distinct error channels:
Execution errors are what every platform handles — the step threw an exception. Network down, code crash, timeout exceeded. The engine catches it, marks the step as failed, halts the workflow.
Operational errors are the ones nobody else catches. The step ran. It completed. It returned output. But the output indicates the operation failed. An HTTP 400. A CRM rejection. A telephony fault code. The step technically succeeded, but the business operation did not.
Every step type in QuickFlo implements a classifyOutput() method. After the step executes, the engine calls this method to inspect the result:
classifyOutput(output) {
  if (output.status >= 400) {
    return {
      status: 'error',
      errors: [{
        code: 'HTTP_CLIENT_ERROR',
        message: `${output.status}: ${output.body?.error || 'Request failed'}`
      }]
    };
  }
  return { status: 'ok' };
}
The HTTP step checks the status code. The Five9 step checks for SOAP fault codes. The CRM step checks the API’s own error structure. Each step type knows what “success” actually means for its domain.
When the engine gets back anything other than { status: 'ok' }, it treats the step as failed — same as an execution error. The workflow halts by default. The error is structured, surfaced in the execution trace, and available to downstream steps through the $errors context variable.
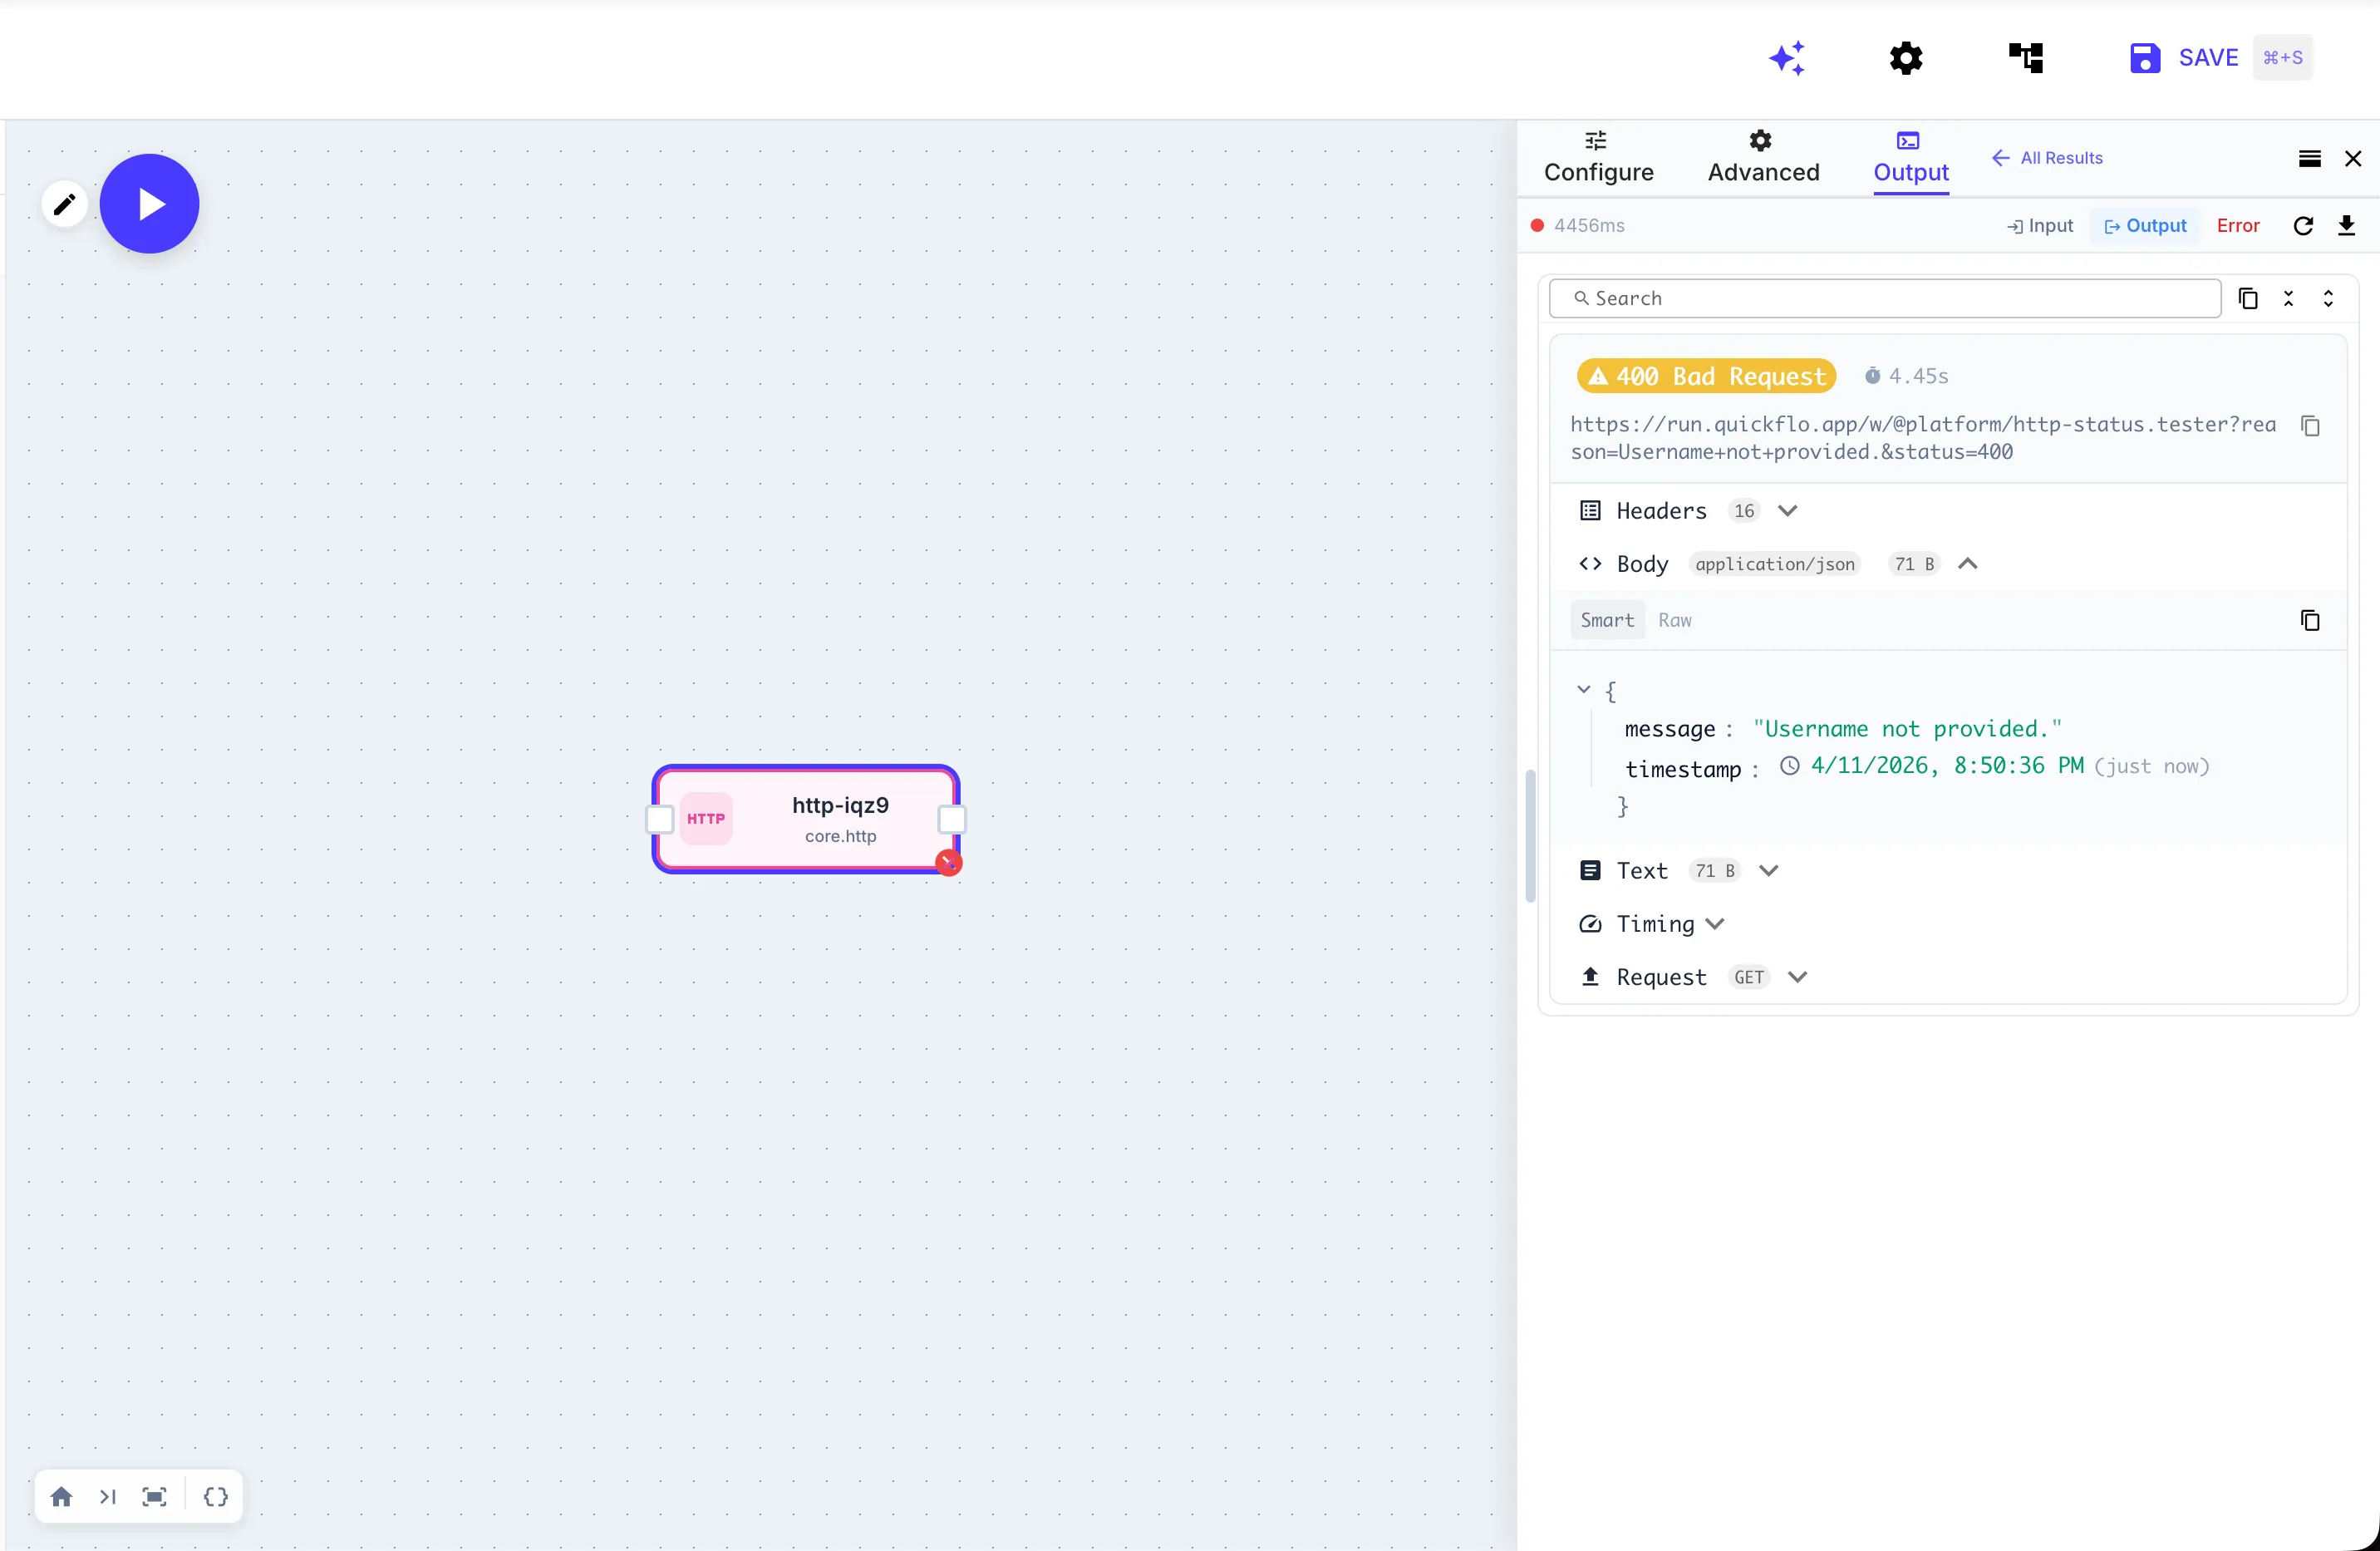
That is what QuickFlo shows you when an HTTP step gets a 400. The full URL. The status code. The response headers. The parsed JSON body with the actual error message — in this case, "Username not provided." You also get timing data and the full outbound request details. Everything you need to understand what happened, on one screen, without clicking through anything.
The key decision was making operational errors halt the workflow by default. I went back and forth on this. The “safe” choice would be to surface the information but let the workflow continue — that is less disruptive. But the whole point is that silent continuation is the problem. If something went wrong, I want the workflow to stop and make noise. The default should be: if the operation failed, stop.
To be explicit about what this means in practice: you do not have to configure anything for this to work. You add an HTTP step to your workflow. It calls an API. The API returns a 400. The workflow halts and the error is surfaced in the execution trace with a structured classification — HTTP_CLIENT_ERROR, HTTP_SERVER_ERROR, or HTTP_RATE_LIMITED — plus the response body and a human-readable message. You did not write a conditional. You did not check a status code. You did not add error handling. The engine handled it because the HTTP step knows what an HTTP error looks like, the Five9 step knows what a SOAP fault looks like, the CRM step knows what an API rejection looks like. Every step type has its own error taxonomy built in. That is the feature. Fail loud, fail fast, automatically.
On every other platform, that same 400 response silently passes through unless you manually added a conditional step to check the status code, wrote the branching logic, and remembered to do it on every single step that talks to an external system. On QuickFlo, you do nothing and it works.
If you need more granularity, it is there. You can enable continueOnError on a step to catch operational errors and route around them — trigger a Slack alert, log to a dead-letter queue, retry with different parameters. The error becomes a value you can branch on via $meta.operationalStatus instead of a halt.
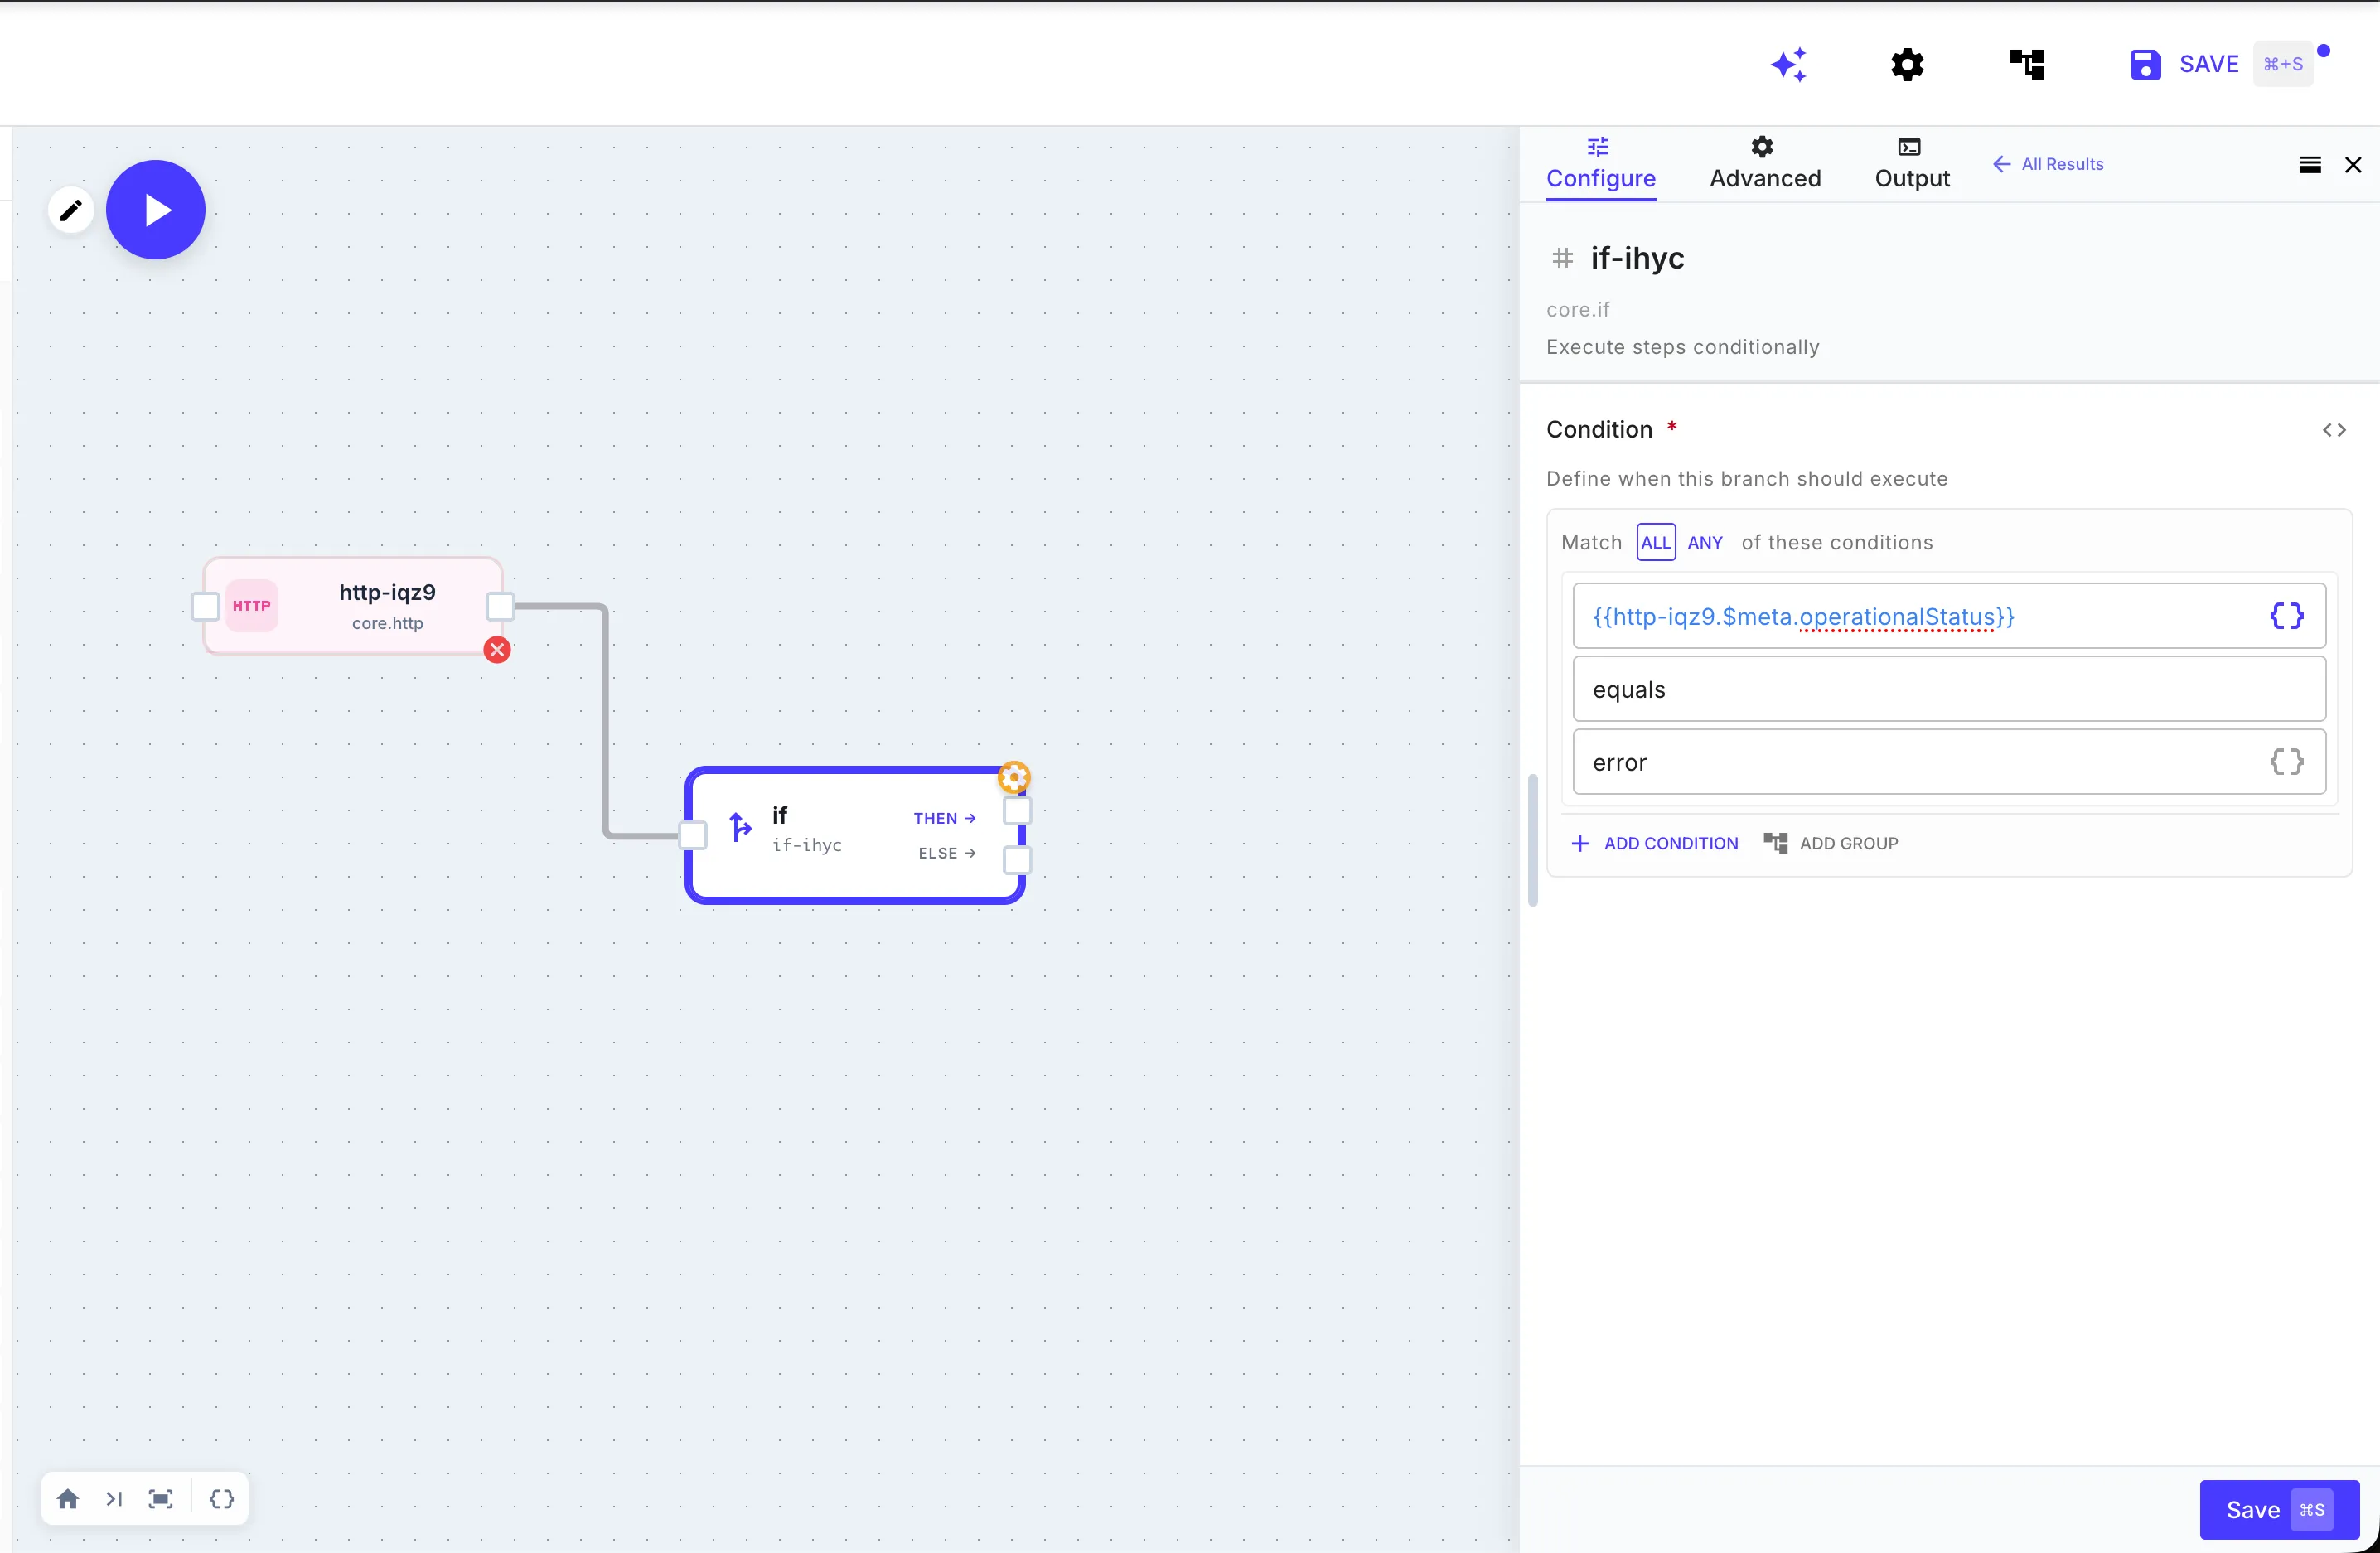
You can also customize what counts as an error in the first place. The HTTP step’s advanced error handling lets you configure which status codes are retryable, which methods are safe to retry, and how the classification interacts with your retry policy. If your API returns a 422 that should be treated as success for a specific workflow, you configure that per step. The point is that the defaults are safe out of the box, and the customization is there when you need it.
Replay any execution, step by step
In QuickFlo, you can take any past execution — from yesterday, from last week, from three months ago — and replay it directly in the workflow builder. Not re-run it. Replay it. You step through the workflow node by node, seeing the exact data that flowed through each step, the exact outputs, the exact errors. It is the actual workflow canvas, loaded with real execution data, as if you had run that workflow in your browser right now.
Make has something called Scenario Run Replay, but it re-executes the scenario from scratch using old trigger data. That is useful for reproducing issues, but it is a different thing entirely — you are running the workflow again, not inspecting what happened the first time. Every other platform gives you a log viewer, which means clicking through individual step logs one at a time, mentally reconstructing the data flow in your head.
The difference matters most when the error is not at the step that failed. Debugging is rarely about the step with the red icon. It is about the step three hops upstream that produced subtly wrong data, which cascaded through two more transformations before something finally broke. On a log viewer, you have to manually trace that chain. On QuickFlo’s execution replay, you just click through the steps and see it.
The AI debugging piece
One more thing that matters here. QuickFlo’s AI Builder has access to the full execution trace of every workflow run. When something fails — execution error or operational error — you can ask the AI what happened. It does not generate generic troubleshooting steps. It reads the actual inputs, outputs, status codes, and error messages from your specific failed run and tells you what went wrong.
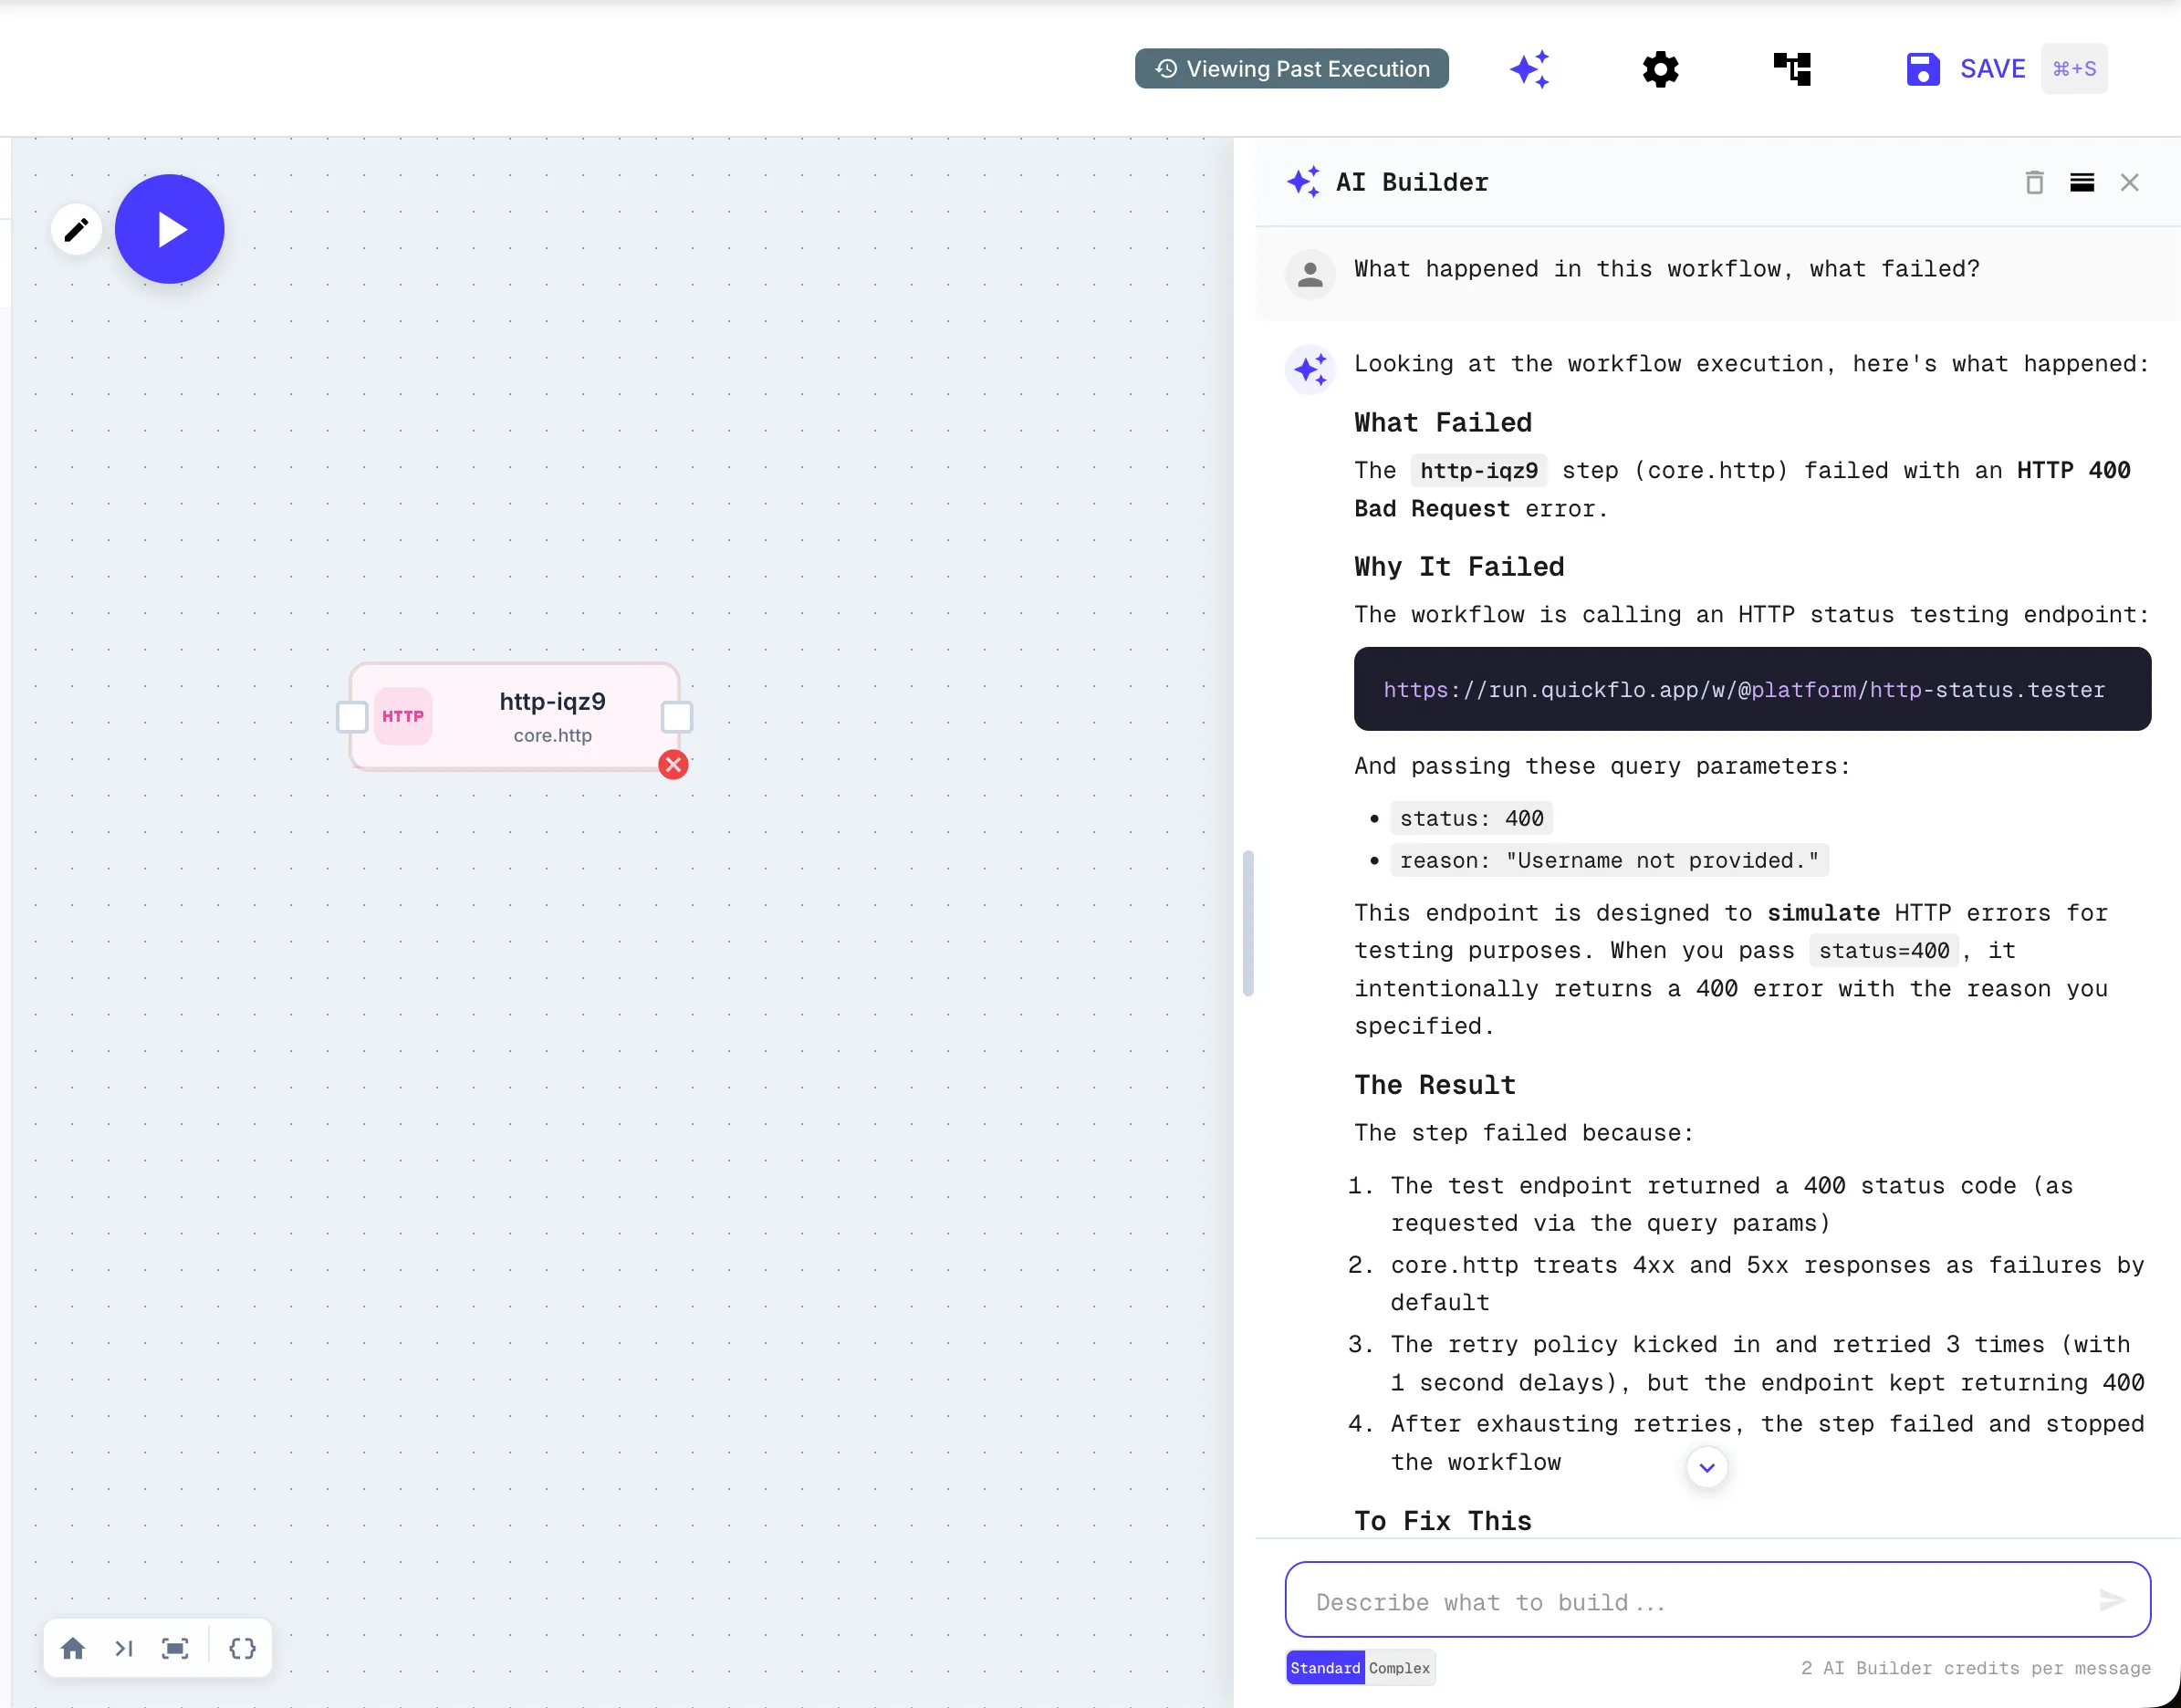
The AI identified the exact step that failed (http-iqr9), the HTTP status code (400), the endpoint URL, the query parameters that were sent, and even explained the retry behavior — three attempts with one-second delays before the step was marked as failed. This is not a generic “check your configuration” suggestion. It is reading the execution trace from this specific run and walking you through what happened.
Every major platform is investing in AI now. Zapier has its own Copilot (yes, both Zapier and Microsoft use the name) for building workflows, plus an Agents product for autonomous actions. Make has Maia for conversational scenario building. Power Automate’s Copilot can generate flows and has a “Troubleshoot in Copilot” feature for error diagnosis. These are all useful for building workflows from natural language, and I am not going to pretend otherwise — that is a category where everyone is competitive.
Debugging is a different story. None of them read the full execution context.
Power Automate comes closest — its troubleshooter can read the error message from a failed run and summarize it in plain English. But it reads the error string, not the execution trace. It sees that step 12 got a 422 and suggests fixes for step 12. It cannot look at step 4’s output and tell you that the data was already wrong before it got there. Microsoft’s own docs caveat it: “Copilot isn’t equipped to help with fixing flow errors currently.”
Zapier has a beta AI troubleshooter that summarizes errors from failed tasks — it identifies the failed step, interprets the error, and suggests fixes. That puts it ahead of Make’s Maia, which does not attempt debugging at all and operates entirely at the definition level. But like Power Automate, Zapier’s troubleshooter works on the error at the point of failure. It does not trace the execution backward to find where the data went wrong upstream.
QuickFlo’s AI reads the full execution trace. Every step’s inputs, outputs, status codes, error messages, timing. When you ask “what happened in this workflow, what failed?” it does not guess. It walks the trace:
The
http-iqr9step failed with an HTTP 400 Bad Request. The endpoint returned a 400 because you passedstatus=400andreason="Username not provided."The retry policy kicked in and retried 3 times with 1-second delays, but the endpoint kept returning 400. After exhausting retries, the step failed and stopped the workflow.
That is from the screenshot above. That is not a canned response. The AI read the execution data — the URL, the query parameters, the retry attempts, the response body — and explained exactly what happened. It is the difference between “something went wrong at step 12” and a full root-cause analysis that traces the failure back through the data flow.
The question nobody asks during evaluation
When you are evaluating workflow platforms, the demo always goes well. The step connects, the data flows, the output looks right. Nobody evaluates what happens when the step connects, the data flows, and the output is a 400 error that the platform treats as success.
Next time you are comparing tools, run this test: set up an HTTP step that deliberately hits an endpoint returning a 400 with a JSON error body. See what the platform shows you. See if it stops the workflow. See if you can find the response body without clicking through four screens. See if the platform even knows something went wrong.
That will tell you more about the tool than any feature comparison page ever will.